Ethereum has dropped to multi-year lows as a key on-chain profitability metric falls to its lowest level since 2017, raising fresh questions about whether the market has fully priced in the current bear cycle.
Summary
- assnode data shows only 11% of the Ethereum supply remains in 3x profit, the lowest level since February 2017.
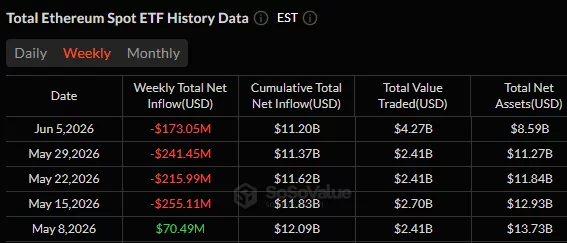
- U.S. spot Ethereum ETFs have recorded roughly $845 million in outflows over the past month, highlighting weak institutional demand.
- ETH faces key resistance near $1,700 as analysts warn historical bottom signals have yet to fully appear.
According to crypto.news data, Ethereum (ETH) price traded near $1,685 on June 8 after rebounding from a recent low around $1,505 during last week’s market-wide liquidation event. Despite the recovery, ETH remains one of the worst-performing major cryptocurrencies this year as investors continue reducing exposure to risk assets.
According to SoSoValue data, U.S. spot Ethereum ETFs have recorded roughly $885 million in net outflows over the past month, extending a multi-week trend of institutional capital leaving Ethereum investment products.
The withdrawals coincided with falling derivatives activity, as open interest and leveraged long exposure declined sharply during the correction.
At the same time, on-chain data suggests Ethereum holders have lost much of the profit cushion that supported previous bull markets.
Data from Glassnode shows that only 11% of Ethereum’s circulating supply is currently sitting on unrealized gains greater than 300%, matching levels last seen in February 2017. Unlike previous cycles, Ethereum never achieved the same profitability expansion seen during the 2017-18 and 2020-21 bull markets, when more than half of the network’s supply sat on gains exceeding 300%.
Hence, it suggests far fewer Ethereum holders accumulated the outsized profits seen in earlier cycles, leaving a larger share of investors much closer to their entry prices during the latest downturn.
Historical bottom signals have not appeared yet
Several analysts argue that the collapse in deeply profitable supply leaves Ethereum approaching an important inflection point.
According to crypto analyst Ardi, previous Ethereum bear markets reached their final lows only after weekly RSI broke below the 30 level and remained there for several weeks.
“We haven’t entered that oversold region yet, and we’re sitting just below $1,700. That’s not exactly a great spot to be in when the major macro support is only 15% below the current price.”
The observation comes as Ethereum’s weekly RSI hovers near 31, slightly above the oversold zone that accompanied major cycle lows in both 2018 and 2022.
Ardi also noted that the current cycle differs from previous ones because Ethereum never experienced the kind of parabolic breakout that characterized earlier bull markets. ETH has spent an unusually long period trading in the lower half of its RSI range, raising the possibility that the asset may not require the same type of capitulation event seen in prior bear cycles.
Macro conditions have complicated the outlook. Stronger-than-expected U.S. labor market data last week reduced expectations for Federal Reserve rate cuts, strengthening the dollar and weighing on risk assets. Bitcoin’s break below $60,000 triggered a wave of liquidations across crypto markets that pushed Ethereum toward levels last seen in early 2023.
Key resistance remains near $1,700
Price action now places Ethereum at an important technical level. The daily chart shows ETH trading beneath a descending trendline that has capped rallies since April.
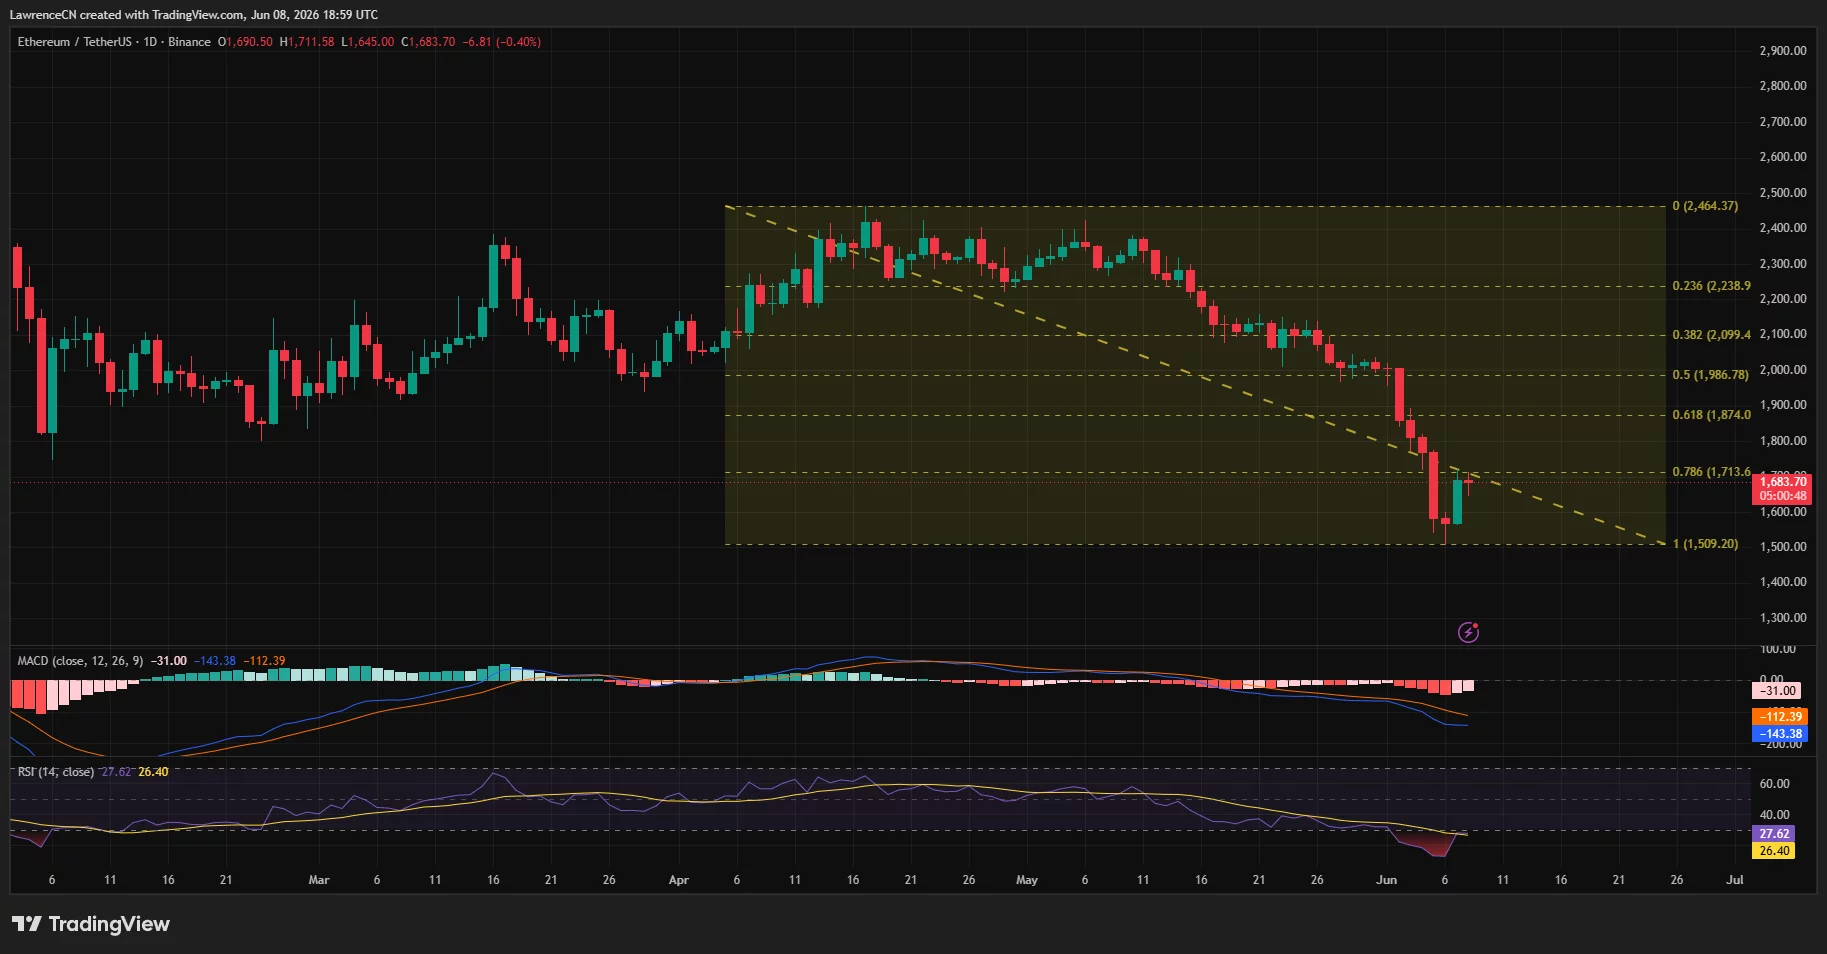
Following its rebound from the 1.0 Fibonacci retracement level near $1,509, ETH price is attempting to reclaim resistance around $1,714. A breakout above that level could open the door toward $1,874 and $1,987.
Momentum indicators remain mixed. Daily RSI has recovered from oversold territory but remains below the neutral 50 mark, while MACD continues to trade below its signal line despite showing early signs of stabilization.
Shorter-term charts show Ethereum forming a bearish flag after rebounding from its June 6 low near $1,505. The recovery has unfolded within an upward-sloping channel, with price now testing both the upper boundary of the pattern and Supertrend resistance near $1,710.
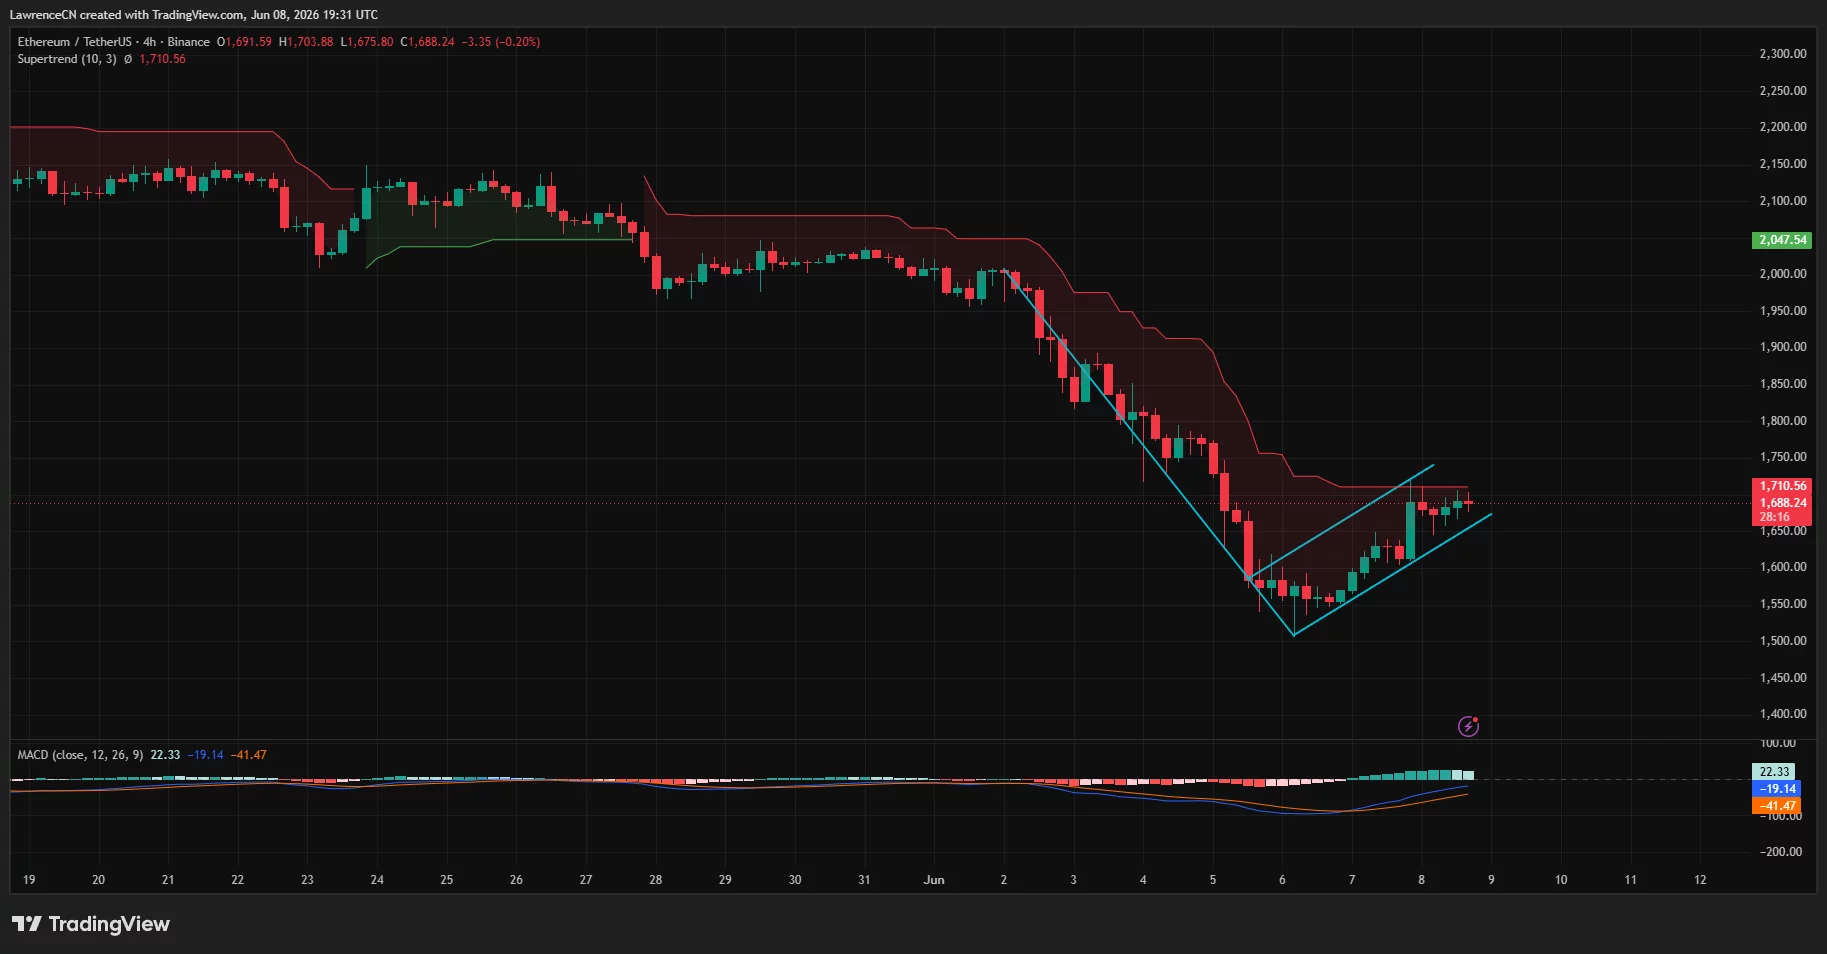
A rejection from current levels could reinforce the bearish flag structure and bring the $1,505 support area back into focus. Conversely, a move above Supertrend resistance near $1,710 and the channel would invalidate the bearish setup and suggest buyers are regaining control.
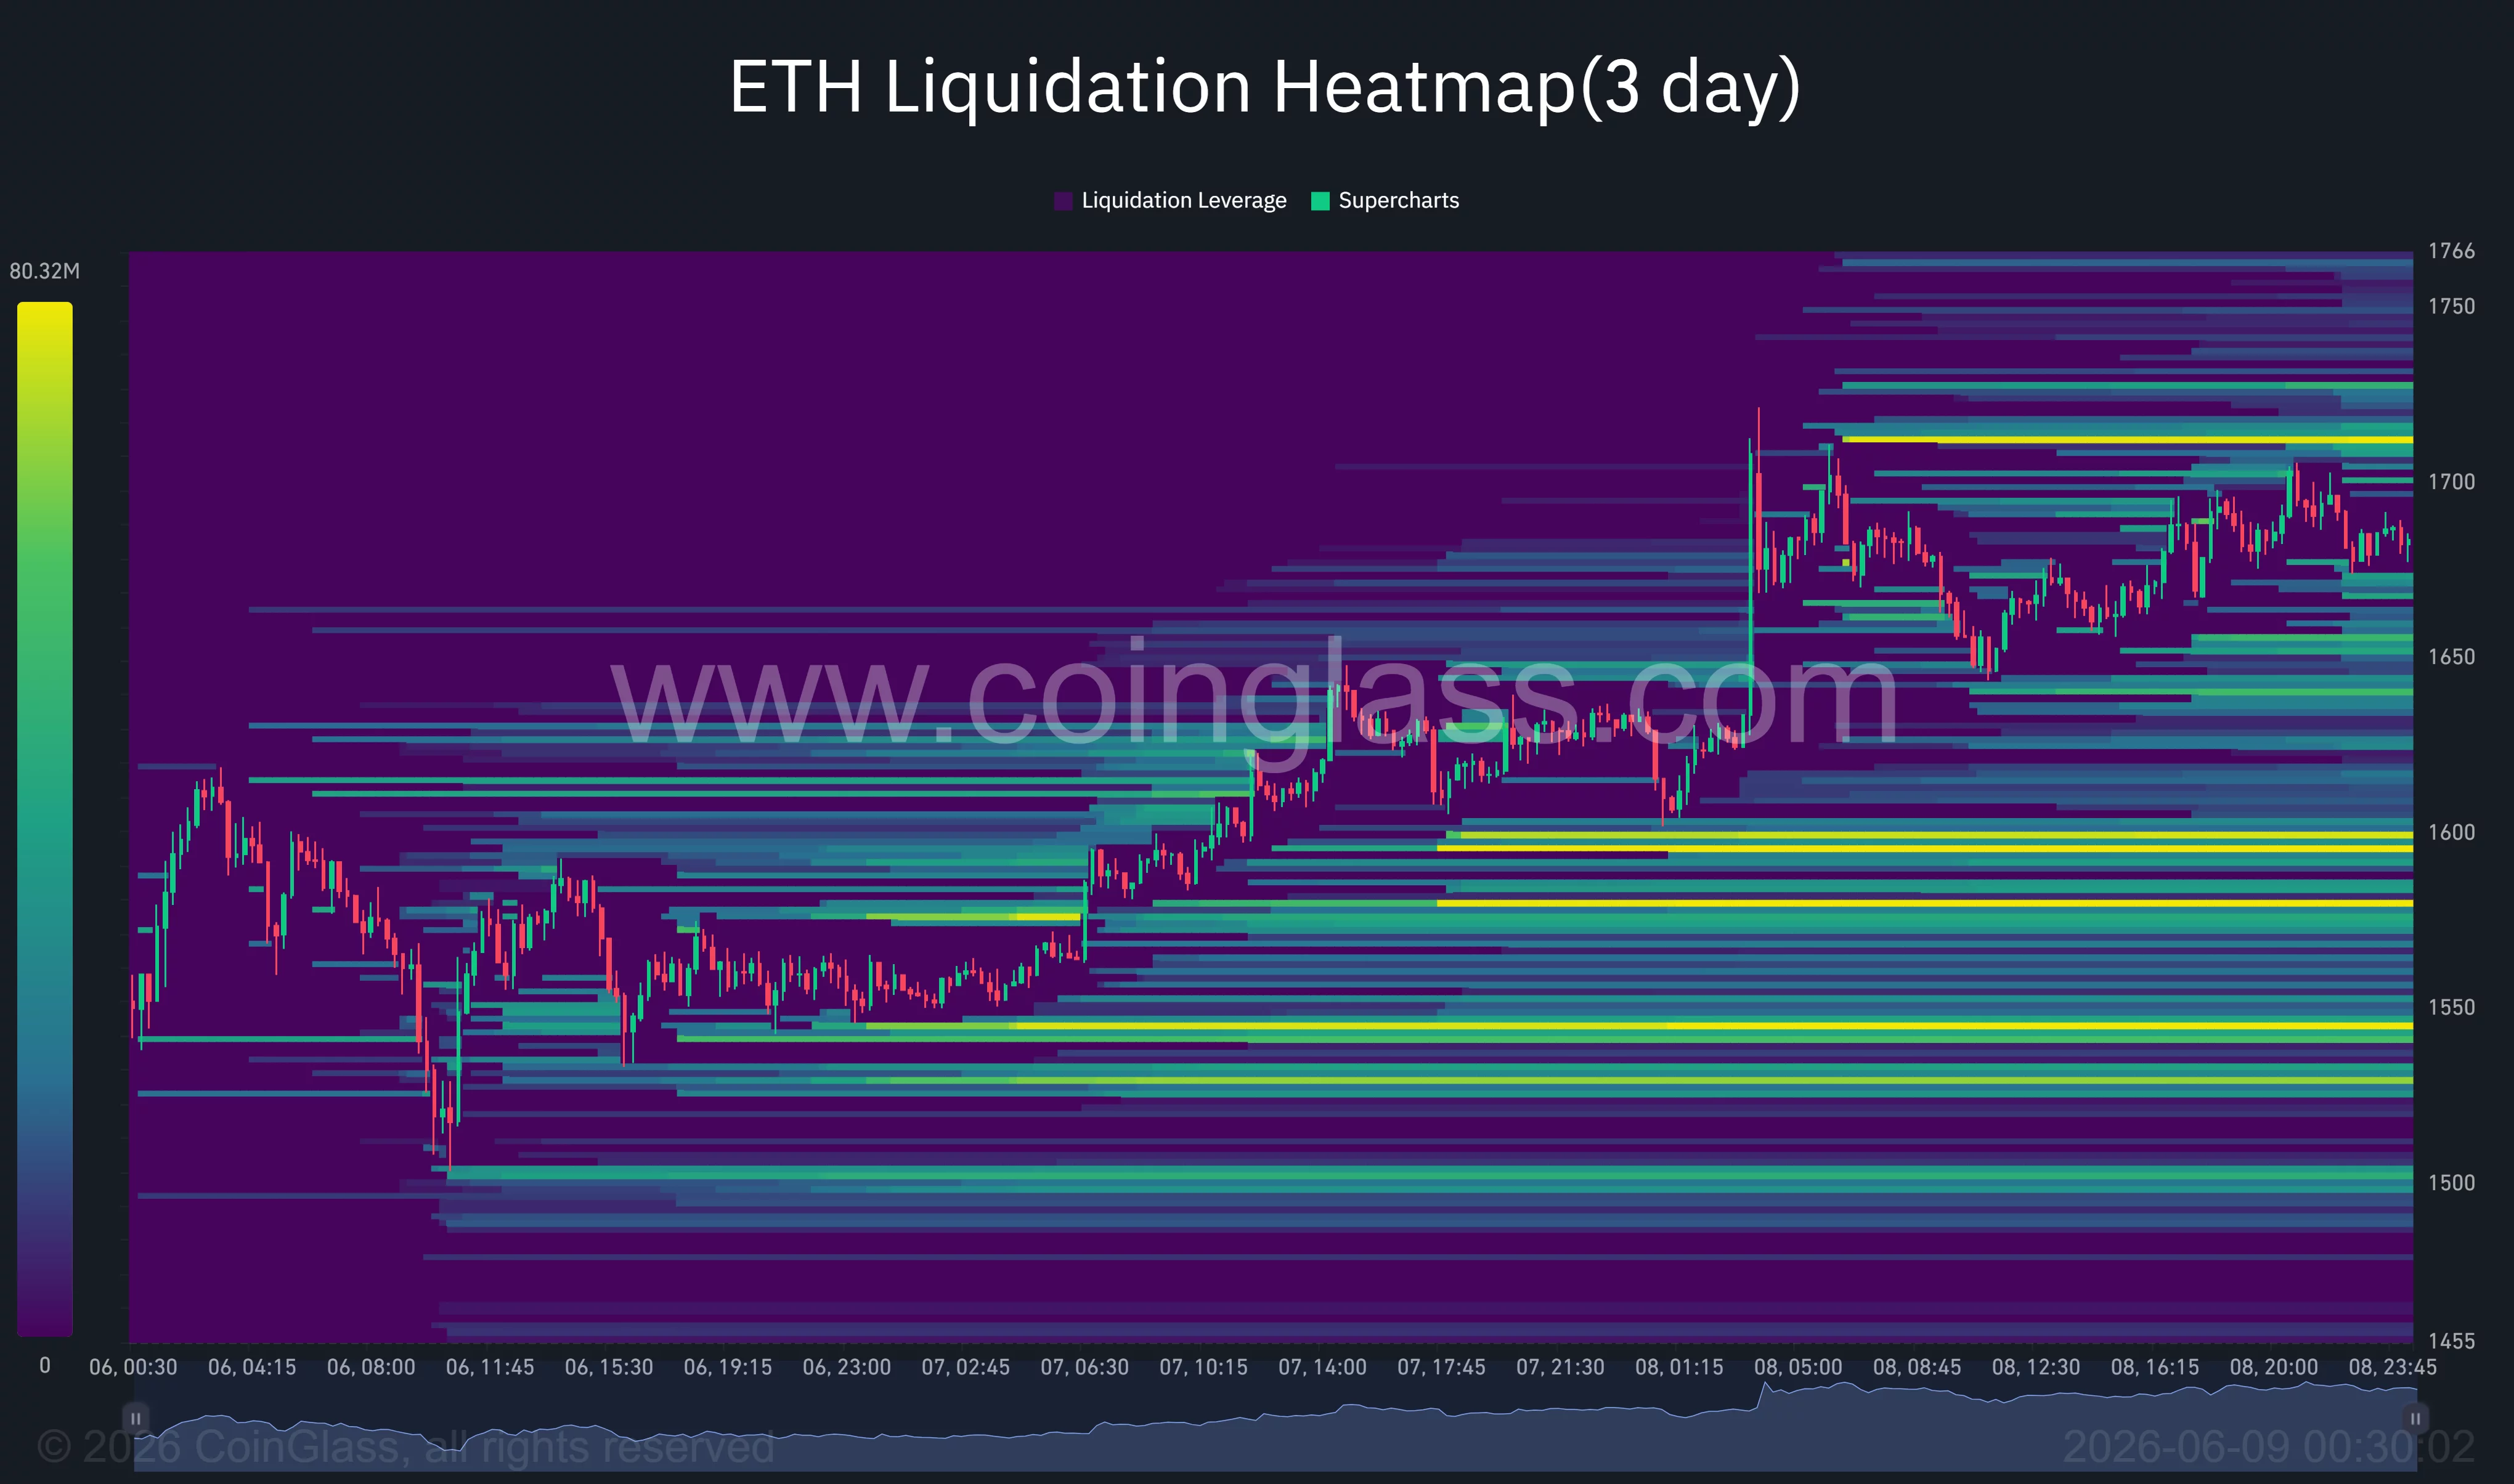
CoinGlass liquidation data shows a large cluster of short liquidations between $1,710 and $1,730, while significant long liquidation pools remain concentrated around $1,600, $1,580, and $1,540. Those levels could become important liquidity targets if volatility increases.
For now, Ethereum remains caught between a historically weak profitability profile and a technical structure that has yet to confirm a sustained reversal. Whether the latest Glassnode reading represents late-stage capitulation or another stop on the way lower may depend on how buyers respond around the $1,700 level.
Disclosure: This article does not represent investment advice. The content and materials featured on this page are for educational purposes only.


Leave a Reply